One console to rule them all

I love text consoles. The more I can do without moving a mouse or opening a new window, the better. So, when I saw XKCD’s command-line interface, I grabbed the code and started to build new features into it, as my kind of browser window to a cyber world of text.

I want to tell you about my console-based time-management system, the entertainment system, the LambdaMOO world, the integration with my fledgling single-stream analysis toolbox. But the first step was to clean out the password-protected stuff, and expose the console code for anyone who wants it.

So here it is! Feel free to play around on the public version, http://ift.tt/1PEsTtI, or clone the repository for your own.

screenshot

Here are the major changes from the original XKCD code by Chromacode:

  • Multiple “shells”: I currently just have the Javascript and XKCD-Shell ones exposed. Javascript gives you a developer-style javascript console (but buggy). You can switch between the two by typing x: and j:.
  • A bookmark system: ln URL NAME makes a new bookmark; ls lists the available bookmarks, and cd NAME opens a bookmark.
  • A login/registration system: Different users can have different bookmarks (and other stuff). Leave ‘login:’ blank the first time to create a new account.
  • Some new commands, but the only one I’m sure I left in is scholar [search terms] for a Google Scholar search.

Share, expand, and enjoy!
Gnostic Doubts

A while back, I got very excited about Gnosticism and the Nag Hammadi Library. I’m stumbling upon more of that world, with a weird coincidence. The roleplaying game I’m making is set in the time of the rising of Zoroastrianism, and its crusade against untruth and error. Then, this morning, I attended my first (and last?) service of the local Christian Science branch, in a beautiful wooden cathedral on my corn. The rhetoric was strikingly similar: Truth is the only reality, and it is unchanging and godly. Matter and the world as we perceive it is unreal and can neither think nor feel.

With the huge caveat that I know very little of Christian Science or the other two, part of me loves this rationalist vision. It quickly leads to a new conception of the soul and God Itself. If the world does not exist as such, then neither do we as such; whatever it is that is not-matter in us is very close to God, and it is exactly that entity that finds Itself in (or at least surrounded by) error. But therein lies Gnosticism’s central problem.

1. Why would God cause there to be error? The Gnostics blame the demiurge and Zoroaster blamed Angra Mainyu, setting a figurehead on the two sides of their dualistic universe. Christian Scientists have no such choice, so the blame falls to mere mortals. Even for the earlier Gnostics, God seems to have basically given Itself a split-personality disorder. Why would It do that, except that It liked it better that way?

2. It seems dreadful to treat all of nature like an abomination. In his writings, John Muir speaks endlessly of the divinity of nature, the wondrousness of its infinite complexity and the vibrance of its multitudinal spirits. To him, the trees are cathedrals, the clouds are cities; he writes that “many other beautiful winged people, numbered and known and loved only by the Lord, are waltzing together high over head, seemingly in pure play and hilarious enjoyment of their little sparks of life.”

And while I’m sure that many kinds of disease are horrible and without mitigating benefits, those are not the one’s I have been lucky enough to encounter. The diseases I know are wise and deep. As Ginsberg says, “Holy the sea holy the desert holy the railroad holy the locomotive holy the visions holy the hallucinations holy the miracles holy the eyeball holy the abyss!”

Perhaps there is only one reality, and error is all around us. But if so, it seems prudent to look for that reality in the infinite beauty that surrounds us.

Labor Day 2015: More hours for everyone

In the spirit of Labor Day, I did a little research into Labor issues. I wanted to explore how much time people spent either at or in transit to work. Ever since the recession, it seems like we are asked to work longer and harder than ever before. I’m thinking particularly of my software colleagues who put in 60 hour weeks as a matter of course, and I wanted to know if it’s true across sectors. Has the relentless drive for efficiency in the US economy taken us back to the limit of work-life balance?

I headed to the IPUMS USA database and collected everything I could find on the real cost of work.

When you look at average family working hours (that is, including averaged with spouses for couples), there’s been a huge shift, from an average of 20-25 hours/week to 35-40. If those numbers seem low, note that this is divided across the entire year, including vacation days, and includes many people who are underemployed.

The graph below shows the shift, and that it’s not driven by specifically employees or the self-employed. The grey bands show one standard deviation, with a huge range that is even larger for the self-employed.

klass

So who has been caught up in this shift? Everyone, but some industries and occupations have seen their relative quality of life-balance shift quite a bit. The graph below shows a point for every occupation-and-industry combination that represents more than .1% of my sample.

hours

In 1960, you were best off as a manager in mining or construction; and worst as a laborer in the financial sector. While that laborer position has gotten much worse, it has been superseded in hours by at least two jobs: working in the military, and the manager position in mining that once looked so good. My friends in software are under the star symbols, putting in a few more hours than the average. Some of the laboring classes are doing relatively well, but still have 5 more hours of work a week than they did 40 years ago.

We are, all of us, more laborers now than we were 60 years ago. We struggle in our few remaining hours to maintain our lives, our relationships, and our humanity. The Capital class is living large, because the rest of us have little left to live.

A Day for Labor

The meaning of Labor Day seems lost on much of my generation. Many take it to be intrinsically ironic: what a funny thing that we don’t work on Labor Day. But of course it is not ironic at all.

The 1% and the 99% are new names for a newly harsh distinction between Capital and Labor. Even my knowledge-worker class is trapped in a cycle of laboring, with 60 hour weeks just to keep our jobs and housing prices chasing away the gains. We are, all of us, Labor.

99% of our days are spent serving capital, and yet we feel lost on the 1% reserved for ourselves.

So I want to live this day outside the cycle. To contemplate and read. To cook eggs and vegan sausage. To enjoy the sun out of doors. To clean a little, but not for maintenance sake. And yes, to work, but not ironically: I will do a little work for Labor that our day of liberty can come sooner.

The role of non-empirical science

The New York Times has an op-ed today about that argues “Psychology Is Not in Crisis, in response to the response to a paper that tried and failed to reproduce 60 of 100 psychology experiments. I have been thinking for a long time about the importance of falsifiability in science, and the role of the many kinds of research we do in light of it.

I was recently re-perusing Collins et al. 2010, which purports to address the need for an integrated approach to environmental science, with a new conceptual framework. The heart of the framework is the distinction between “pulse” and “press” dynamics. I do not want to explain the difference here though. I want to know if we learn something from it.

Knowledge comes in many forms. There’s empirical knowledge, facts about the world that we know could not have known until they were observed; analytical knowledge, resulting from the manipulation of logical constructs; and wisdom, inarticulable knowledge that comes from experience.

The Collins et al. paper uses analysis, but it proves no theorems. But of course analysis can be a powerful tool without mathematical analytics. Recognizing multiple parts of a whole can open doors in the mind, and provide substance to a question. Nonetheless, the criteria for science of the usefulness of analysis is, does it allow us to learn something we did not already know? Knowing that fire is a pulse dynamic while climate change is a press dynamic could come in handy, if these categories added additional knowledge.

I claim that papers like this do not try to teach analytical knowledge, although they focus on a piece of analysis. Their goal is to expand our wisdom, by giving it shape. The distinction is not tied to anything we did not already know about fire and climate change. Like a professor who notices two things being conflated, the paper tries to expand our vocabulary and through it our world. Alas, it is exactly the wherewithal to shape our conceptual world that constitutes the wisdom sought. Pulse and press dynamics are one nice distinction, but there are so many others that might be relevant. Having a distinction in mind of pulse and press dynamics is only useful if I can transcend it.

Knowledge builds upon itself, and naturally bleeds between empirics, analysis, and wisdom. I am not a psychologist, but I presume that they are seeking knowledge in all of its forms. The discovery that 60 empirical building blocks were not as sure as they appeared does not undermine the process of science in psychology, and indeed furthers it along, but I hope that it undermines psychology-the-field, and the structure of knowledge that it has built.

Public personas in the crossfire

I’ve spoken elsewhere of the way that grad-student life can crowd out real human connections, interests, and awareness. While life as a postdoc seems better, I’ve discovered a new, longer-term struggle around human connections and academics. This post is to apologize for the cross-chatter of research that you’ll see if you follow me in mixed-company social networks (presently, Twitter).

The academic is a sole entrepreneur, treading water in the sea until you catch enough driftwood to build your own boat. Well, it doesn’t need to be that isolating, but the stakes are as high and the self-reliance as complete. Communicating one’s work is a part of the job that has no clean boundaries.

When I post about research, it isn’t meant for most of my friends, and it isn’t a reflection of my passions outside of work. I do it as a signal to the academic world, and my public persona gets caught in the crossfire.

I will keep posting my non-work (read: non-academia) life here, at least at the trickle I have been. If you do want both, or to do your own filtering, feel free to follow my Food for Thought blog, which automatically draws from both the social and research streams.

Crop categories

One thing that makes agriculture research difficult is the cornucopia of agricultural products. Globally, there are around 7,000 harvested species and innumerable subspecies, and even if 12 crops have come to dominate our food, it doesn’t stop 252 crops from being considered internationally important enough for the FAO to collect data on.

Source: Dimensions of Need: An atlas of food and agriculture, FAO, 1995

Source: Dimensions of Need: An atlas of food and agriculture, FAO, 1995

It takes 33 crop entries in the FAO database to account for 90% of global production, of which at 5 of those entries include multiple species.

Global production (MT), Source: FAO Statistics

Global production (MT), Source: FAO Statistics

Worse, different datasets collect information on different crops. Outside of the big three, there’s a Wild West of agriculture data to dissect. What’s a scientist to do?

The first step is to reduce the number of categories, to more than 2 (grains, other) and less than 252. By comparing the categories used by the FAO and the USDA, and also considering categories for major datasets I use, like the MIRCA2000 harvest areas and the Sacks crop calendar (and using a share of tag-sifting code to be a little objective), I came up with 10 categories:

  • Cereals (wheat and rice)
  • Coarse grains (not wheat and rice)
  • Oilcrops
  • Vegetables (including miscellaneous annuals)
  • Fruits (including miscellaneous perennials– plants that “bear fruit”)
  • Actives (spices, psychoactive plants)
  • Pulses
  • Tree nuts
  • Materials (and decoratives)
  • Feed

You can download the crop-by-crop (and other dataset category) mapping, currently as a PDF: A Crop Taxonomy

Still, most of these categories admit further division: fruits into melons, citrus, and non-citrus; splitting out the subcategory of caffeinated drinks from the actives category. What we need is a treemap for a cropmap! The best-looking maps I could make were using the R treemap package, shown below with rectangles sized by their global harvest area.

treemap

You can click through a more interactive version, using Google’s treemap library.

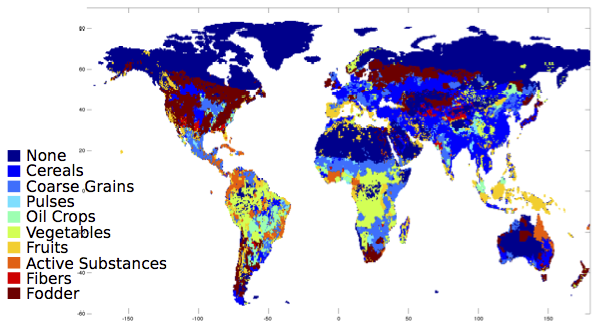
What does the world look like, with these categories? Here, it is colored by which category the majority production crop falls into:

majorities

And since that looks rather cereal-dominated to my taste, here it is just considering fruits and vegetables:

fruitveggie

For now, I will leave the interpretation of these fascinating maps to my readers.

Economic Risks of Climate Change Book out tomorrow!

The research behind the Risky Business report will be released as a fully remastered book, tomorrow, August 11!  This was a huge collaborative effort, led by Trevor Houser, Solomon Hsiang, and Robert Kopp, and coauthored with nine others, including me:

Economic Risks of Climate Change

From the publisher’s website:

Climate change threatens the economy of the United States in myriad ways, including increased flooding and storm damage, altered crop yields, lost labor productivity, higher crime, reshaped public-health patterns, and strained energy systems, among many other effects. Combining the latest climate models, state-of-the-art econometric research on human responses to climate, and cutting-edge private-sector risk-assessment tools, Economic Risks of Climate Change: An American Prospectus crafts a game-changing profile of the economic risks of climate change in the United States.

The book combines an exciting new approach to solidly ground results in data with an extensive overview of the world of climate change impacts. Take a look!

Living in Berkeley

I’m now settled into a studio just south of the UC Berkeley campus. With a built-in secretary, a lock on just the bedroom side of the door to the kitchen, and a tight service stairway out of the kitchen, the apartment feels bizarrely colonial.

I’m only sometimes here though. I was just in NYC for a week, and I fly back for another week on Monday. After some prodding at my going-away party, I’m going to take these trips as an opportunity to get back into a little D&D. Here’s the idea for my nascent campaign:

The year is 500 BCE, and the Persian Empire is the crossroads of the world. This is not quite the ancient Persia of history books: it is a place of wonders and legend and secret crafts. But times are changing, whispered by sages and hinted in strange news from distant lands. They say that new gods are coming, old gods will fall, and it is time for everyone to collect their allies close for the coming chaos.

I’ve also been having some fun with GIS, to combine fantasy and history:

Guest Post: The trouble with anticipation (Nate Neligh)

Hello everyone, I am here to do a little guest blogging today. Instead of some useful empirical tools or interesting analysis, I want to take you on a short tour through of the murkier aspects of economic theory: anticipation. The very idea of the ubiquitous Nash Equilibrium is rooted in anticipation. Much of behavioral economics is focused on determining how people anticipate one another’s actions. While economists have a pretty decent handle on how people will anticipate and act in repeated games (the same game played over and over) and small games with a few different decisions, not as much work has been put into studying long games with complex history dependence. To use an analogy, economists have done a lot of work on games that look like poker but much less work on games that look like chess.

One of the fundamental problems is finding a long form game that has enough mathematical coherence and deep structure to allow the game to be solved analytically. Economists like analytical solutions when they are available, but it is rare to find an interesting game that can be solved by pen and paper.

Brute force simulation can be helpful. Simply simulating all possible outcomes and using a technique called backwards induction, we can solve the game in a Nash Equilibrium sense, but this approach has drawbacks. First, the technique is limited. Even with a wonderful computer and a lot of time, there are some games that simply cannot be solved in human time due to their complexity. More importantly, any solutions that are derived are not realistic. The average person does not have the ability to perform the same computations as a super computer. On the other hand, people are not as simple as the mechanical actions of a physics inspired model.

James and I have been working on a game of strategic network formation which effectively illustrates all these problems. The model takes 2 parameters (the number of nodes and the cost of making new connections) and uses them to strategically construct a network in a decentralized way. The rules are extremely simple and almost completely linear, but the complexities of backwards induction make it impossible to solve by hand for a network of any significant size (some modifications can be added which shrink the state space to the point where the game can be solved). Backwards induction doesn’t work for large networks, since the number of possible outcomes grows at a rate of (roughly) but what we can see is intriguing. The results seem to follow a pattern, but they are not predictable.

The trouble with anticipation


Each region of a different color represents a different network (colors selected based on network properties). The y-axis is discrete number of nudes in the network. The x axis is a continuous cost parameter. Compare where the color changes as the cost parameter is varied across the different numbers of nodes. As you can see, switch points tend to be somewhat similar across network scales, but they are not completely consistent.

Currently we are exploring a number of options; I personally think that agent-based modeling is going to be the key to tackling this type of problem (and those that are even less tractable) in the future. Agent based models and genetic algorithms have the potential to be more realistic and more tractable than any more traditional solution.

Sustainability, Engineering, and Philosophy